Hidden Dangers
An Exploration of Illinois’ Hazards
From extreme weather high in the atmosphere to abandoned coal mines far below the ground, natural and manmade hazards can pose life-threatening emergencies and severe economic losses. Prairie Research Institute (PRI) experts in various fields study these hazards, seeking ways to reduce loss of life and financial burdens for victims.
PRI offers the expertise, research, long-term databases, maps, and other tools to understand hazards from above and below. This information is valuable to individuals, businesses, communities, and agencies— anyone affected when hazards inflict personal and property damages.
Weathering the storm: Charting Illinois’ climate course
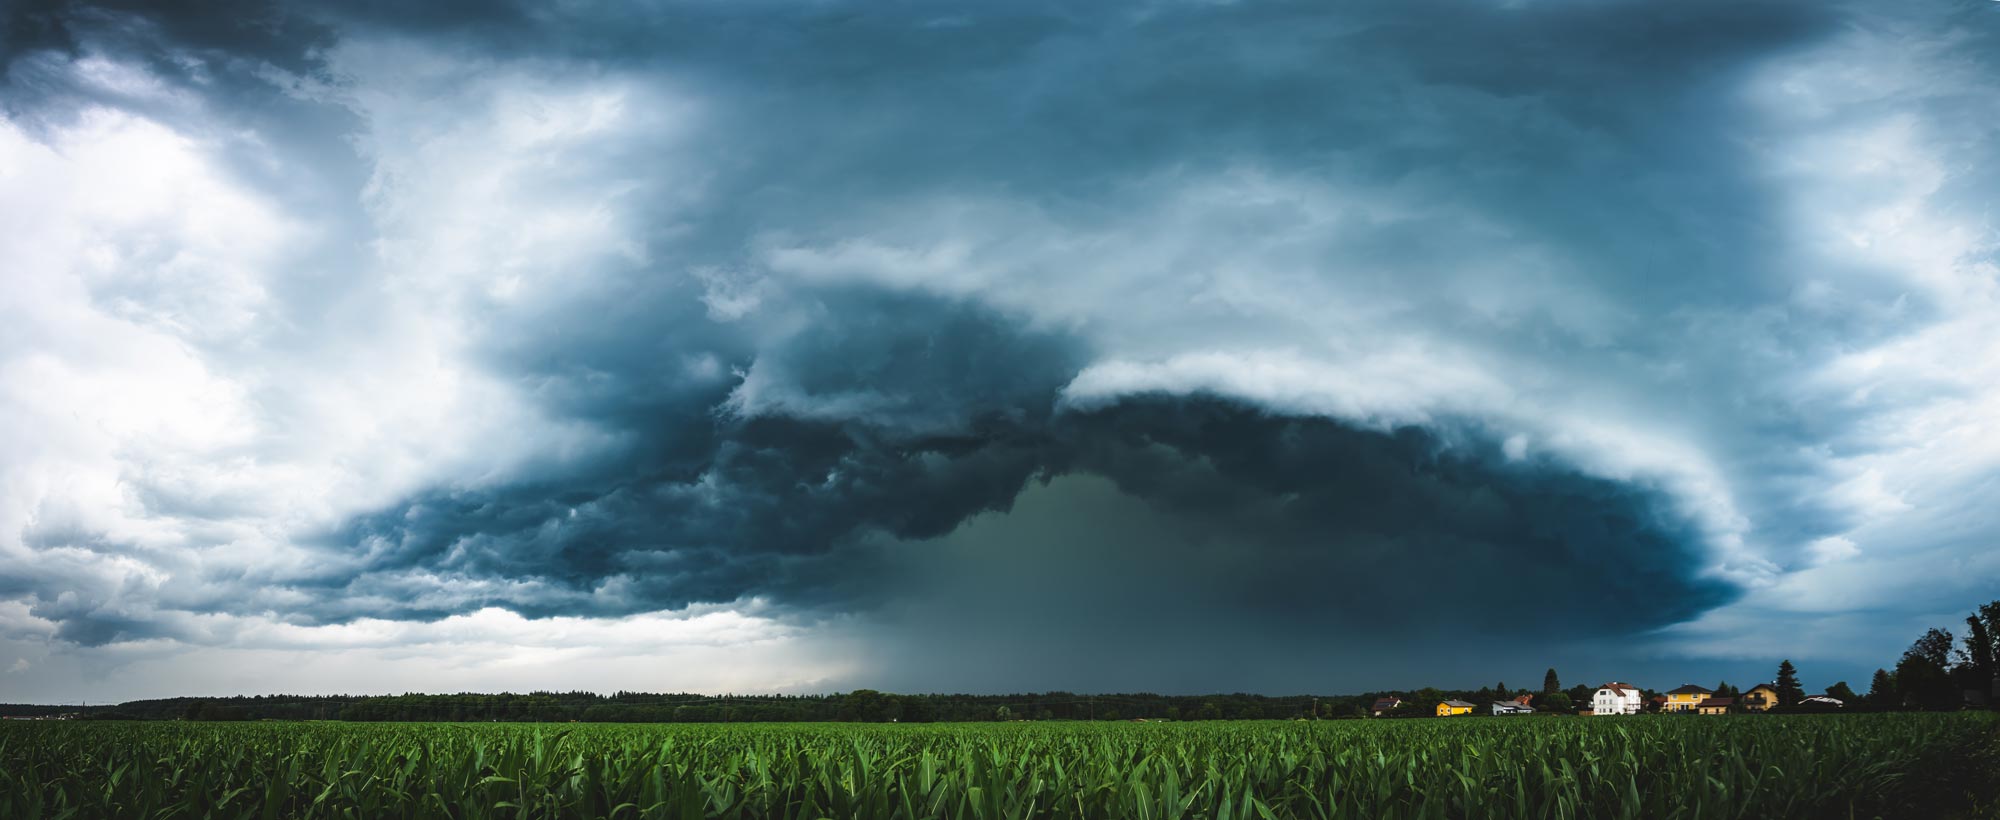
For decades, Illinoisans have been vulnerable to the effects of climate change, which are expected to worsen in the future. Rising temperatures in all seasons lead to more severe heat waves, extended drought, air quality issues, and extreme storms. With historical changes in the intensity and frequency of rainfall, flooding occurs more often, potentially leading to public health hazards, such as water contamination and exposure to infectious diseases.
Illinois State Climatologist Trent Ford is the state’s authoritative spokesperson on climate science. Ford has been in this position since 2019, but the role was initiated by state statute in the 1950s at the Illinois State Water Survey (ISWS). Ford talks frankly about climate change to raise awareness and encourage action.
Ford speaks with a wide variety of groups in communities and at conferences, drawing on data he has gleaned from University of Illinois research, meteorologists, and federal agencies. He is also the point person with climate science expertise, offering climate projections to state government agencies and participating in developing documents such as the state water plan and the state hazard mitigation plan. He also brings specific climate change issues to the forefront.
One example is the need for legislation for a group vulnerable to the ever-increasing extreme heat: migrant farm workers.
“I’ve been harping about migrant farm workers for over two years now,” Ford said. “There are only four states in the US that have any legislative protection for them in experiencing extreme heat, and Illinois is not one of them. This group is completely unprotected.”
During this past summer’s drought, Ford took responsibility to stay on top of the conditions for the duration to understand the drought’s complexity and ensure that weather and drought monitoring were sufficient to capture data. From April to August when the drought lessened somewhat, Ford spoke to as many as 70 reporters about drought conditions in Illinois.
This year has also been especially challenging for Ford because of tornadoes, dust storms, air quality problems from wildfires, and heat waves.
“I’m having to triage,” he said. “This is really a clear sign of changes in the climate system, the fact that we are having years like this when there are way more extreme events than we can possibly dig into.”
Ford has co-authored several research articles, including “Effects of 0.5°C less global warming on climate extremes in the contiguous United States“. More information about climate change is on the Illinois State Climatologist website.
Diving into data: Taking proactive measures to mitigate Illinois’ growing flood threat
As Illinois experiences record-breaking rainfall stretching from Chicago to Cairo, ISWS researchers collect data and update climate models for Bulletin 75, the publication that provides Illinois’ standards for expected extreme storms.
“The heavy precipitation in Illinois and the Midwest presents a significant challenge in terms of stormwater management,” hydrologist Momcilo Markus said. “To address the problem effectively, more accurate predictions of future rainfall intensity and frequency are critical and require up-to-date assessments of current climate conditions and model-generated data for future horizons.”
Markus, a co-author of Bulletin 75, uses climate modeling projections, which indicate that not only is rainfall expected to increase, but that the amount of the increase will grow.
Effective January 2020, the Illinois Department of Natural Resources Office of Water Resources and District 1 of the Illinois Department of Transportation began requiring Bulletin 75 rainfall for newly initiated projects. The Federal Emergency Management Agency (FEMA) will also accept Bulletin 75 rainfall data for projects and map revisions. Illinois counties and communities are expected to update ordinances that will adopt the new Bulletin 75 standards for building structures based according to a predefined storm magnitude and duration.
Bulletin 75, supported by the Illinois Department of Commerce and Economic Opportunity and the US Department of Housing and Urban Development, used an additional 34 years of data from an earlier version, revealing that the number of storms in Illinois producing over 2 inches of rain has nearly doubled over the past century. During that span, the statewide average annual precipitation has increased 11% and temperatures have risen by 1.2 degrees.
“Climate modeling projections indicate that not only have we seen an increase in rainfall, but that this will increase in the future,” said Markus, “The 100-year, 24-hour rainfall is about 1 inch higher than the old one in the Chicago area — this is 13% higher.”
A 24-hour, 100-year storm event is the amount of rain that should accumulate in a 24-hour period for a storm with a 1-in-100 (or 1%) chance of occurring in a given year. Earlier versions of Bulletin 75 state that a 24-hour, 100-year storm event will result in approximately 7.58 inches of precipitation.
The new data suggest Illinoisans should expect nearly an additional inch of rainfall for a 24-hour, 100-year storm event, or 8.57 inches instead of 7.58 inches.
Flooding is predictable in certain areas, yet too many Illinoisans suffer economic and personal losses when flooding occurs. Homeowners insurance does not cover flood damage, although floods are the most common natural disaster in Illinois, accounting for well over 90% of declared disasters. Financial losses are not reserved to big disasters — just 1 inch of water can cause $25,000 of damage to a home.
To help reduce further losses, the Coordinated Hazard and Assessment Program (CHAMP) engineers, geographic information system (GIS) specialists, and outreach staff conduct studies and work with communities to accurately identify high-risk areas where flooding from rivers and streams is likely to occur.
In the early 2000s, CHAMP was initiated at the ISWS with four staff members to modernize paper Flood Insurance Rate Maps (FIRMs) by converting them into countywide digital products (dFIRMs) as part of FEMA’s Flood Map Modernization effort. FEMA later transitioned the effort into the Risk Mapping Assessment and Planning program, a broader, ongoing program that encompasses a wider range of activities, including risk assessment (flood studies), community engagement, and flood risk mitigation planning.
The CHAMP team, now with about 30 staff members, conducts flood studies using hydrologic and hydraulic modeling of surface water from precipitation events to understand flood risks across the state, as federal funding through FEMA allows. Flood mapping updates are an ongoing process since climate and land use changes can affect rivers and streams. CHAMP has conducted studies on thousands of stream miles in Illinois involving every major watershed in the state and has coordinated efforts with Illinois’ bordering states.
Portion of Champaign County’s Flood Insurance Rate Map (FIRM)
Working with county stakeholders has long been a part of map revisions, but staff have built even closer ties with government and county officials in newer efforts to assist with hazard mitigation plans that encompass earthquakes, tornadoes, heatwaves, and other natural risks besides floods. In partnership with local officials, state agencies, and the U. of I. Extension, the team assembles information from various sources into county-specific plans that enable communities to be prepared for natural disasters and to be eligible for federal assistance when disasters are declared.
A FEMA-approved hazard mitigation plan must be updated every five years and is required for communities to receive federal funding when natural disasters are declared. CHAMP also participates with communities in procuring grants that pay for the development of the plans.
“We are able to collaborate with communities beyond just giving them a document,” Heistand said. “We are actively assisting them to the point of helping them with cost-sharing and grant management.”
CHAMP also acts as a liaison between local officials and the state and federal government as a Cooperating Technical Partner with FEMA. CHAMP is positioned to create and disseminate hazard-related information based on their knowledge of water resources in counties and ongoing relationships with county stakeholders.
CHAMP’s study results, modeling, data collection, and expertise hold value for other kinds of projects as well. For example, CHAMP recently completed a multi-phase project with the Metropolitan Water Reclamation District of Greater Chicago to study the effects of proposed changes to stormwater detention release rates on downstream flooding and water quality. CHAMP’s modeling repository is also useful for consulting engineers in designing land development projects. The models and data could find new uses in machine learning and artificial intelligence applications.
“Someday residents might ask an AI like ChatGPT, ‘What is the flood risk to my home?’” Heistand said. “The answer won’t be possible without all the work we’re doing now.”
Information about county mitigation efforts and maps, projects, and studies is available at illinoisfloodmaps.org.
Unearthing hidden dangers: ISGS’s ongoing effort to document abandoned mines
Beneath the land surface in central and southern Illinois lie more than 7,400 abandoned coal mines. Homes, businesses, and roadways overlying those locations can shift, resulting in cracks in foundations, dropped roadways, buckled pavement, and damaged houses at a significant cost to repair.
Mines can be backfilled at great expense to keep this from happening or potentially avoided altogether with the understanding of where mines are located.
“That’s where we come in,” said Scott Elrick, Illinois State Geological Survey (ISGS) geologist. The ISGS Coal Mines in Illinois Viewer (ILMINES) is the culmination of 80 years of data on Illinois mines, both underground and on the surface. The maps show the location and data collected from an intensive search of historical records to answer these questions: Who mined the area? Where are the mines located? How much coal was mined? Does the amount of recorded volume match up with the area shown on the historical mine maps?
Documentation efforts started in the 1920s with basic map compilations, with another push in the 1950s, and again in the 1980s. Most recently, researchers have incorporated GIS technology with historical research and geologic archives to test and cross-check data, creating the most far-reaching research yet. To date, the work is ongoing.
ILMINES has an average of 160 visitors per day, with up to 400 hits some days. Maps are downloaded about 50,000 times a year. People most likely to use the site include homeowners and real estate agents, insurance companies, banks, engineers, and developers.
The scientists have also developed a mobile-friendly interface so that users can determine, quite literally, if where they are standing is undermined.
To find information beyond what ILMINES has to offer, users can visit an accompanying website, the ILMINES Wiki, that provides directories, photos, statistics, maps, and publications with updated information. The project is supported by the Illinois Department of Transportation, Illinois Mine Subsidence Insurance Fund, and Illinois Department of Natural Resources – Office of Mines and Minerals.
The data for 25% of the coal mines in Illinois are completed, and the other 75% are in different stages. Elrick estimates the project will take another 10 to 15 years to finish. “Once complete, it will be the most definitive work ever done on the coal mined-out areas of Illinois,” he said.
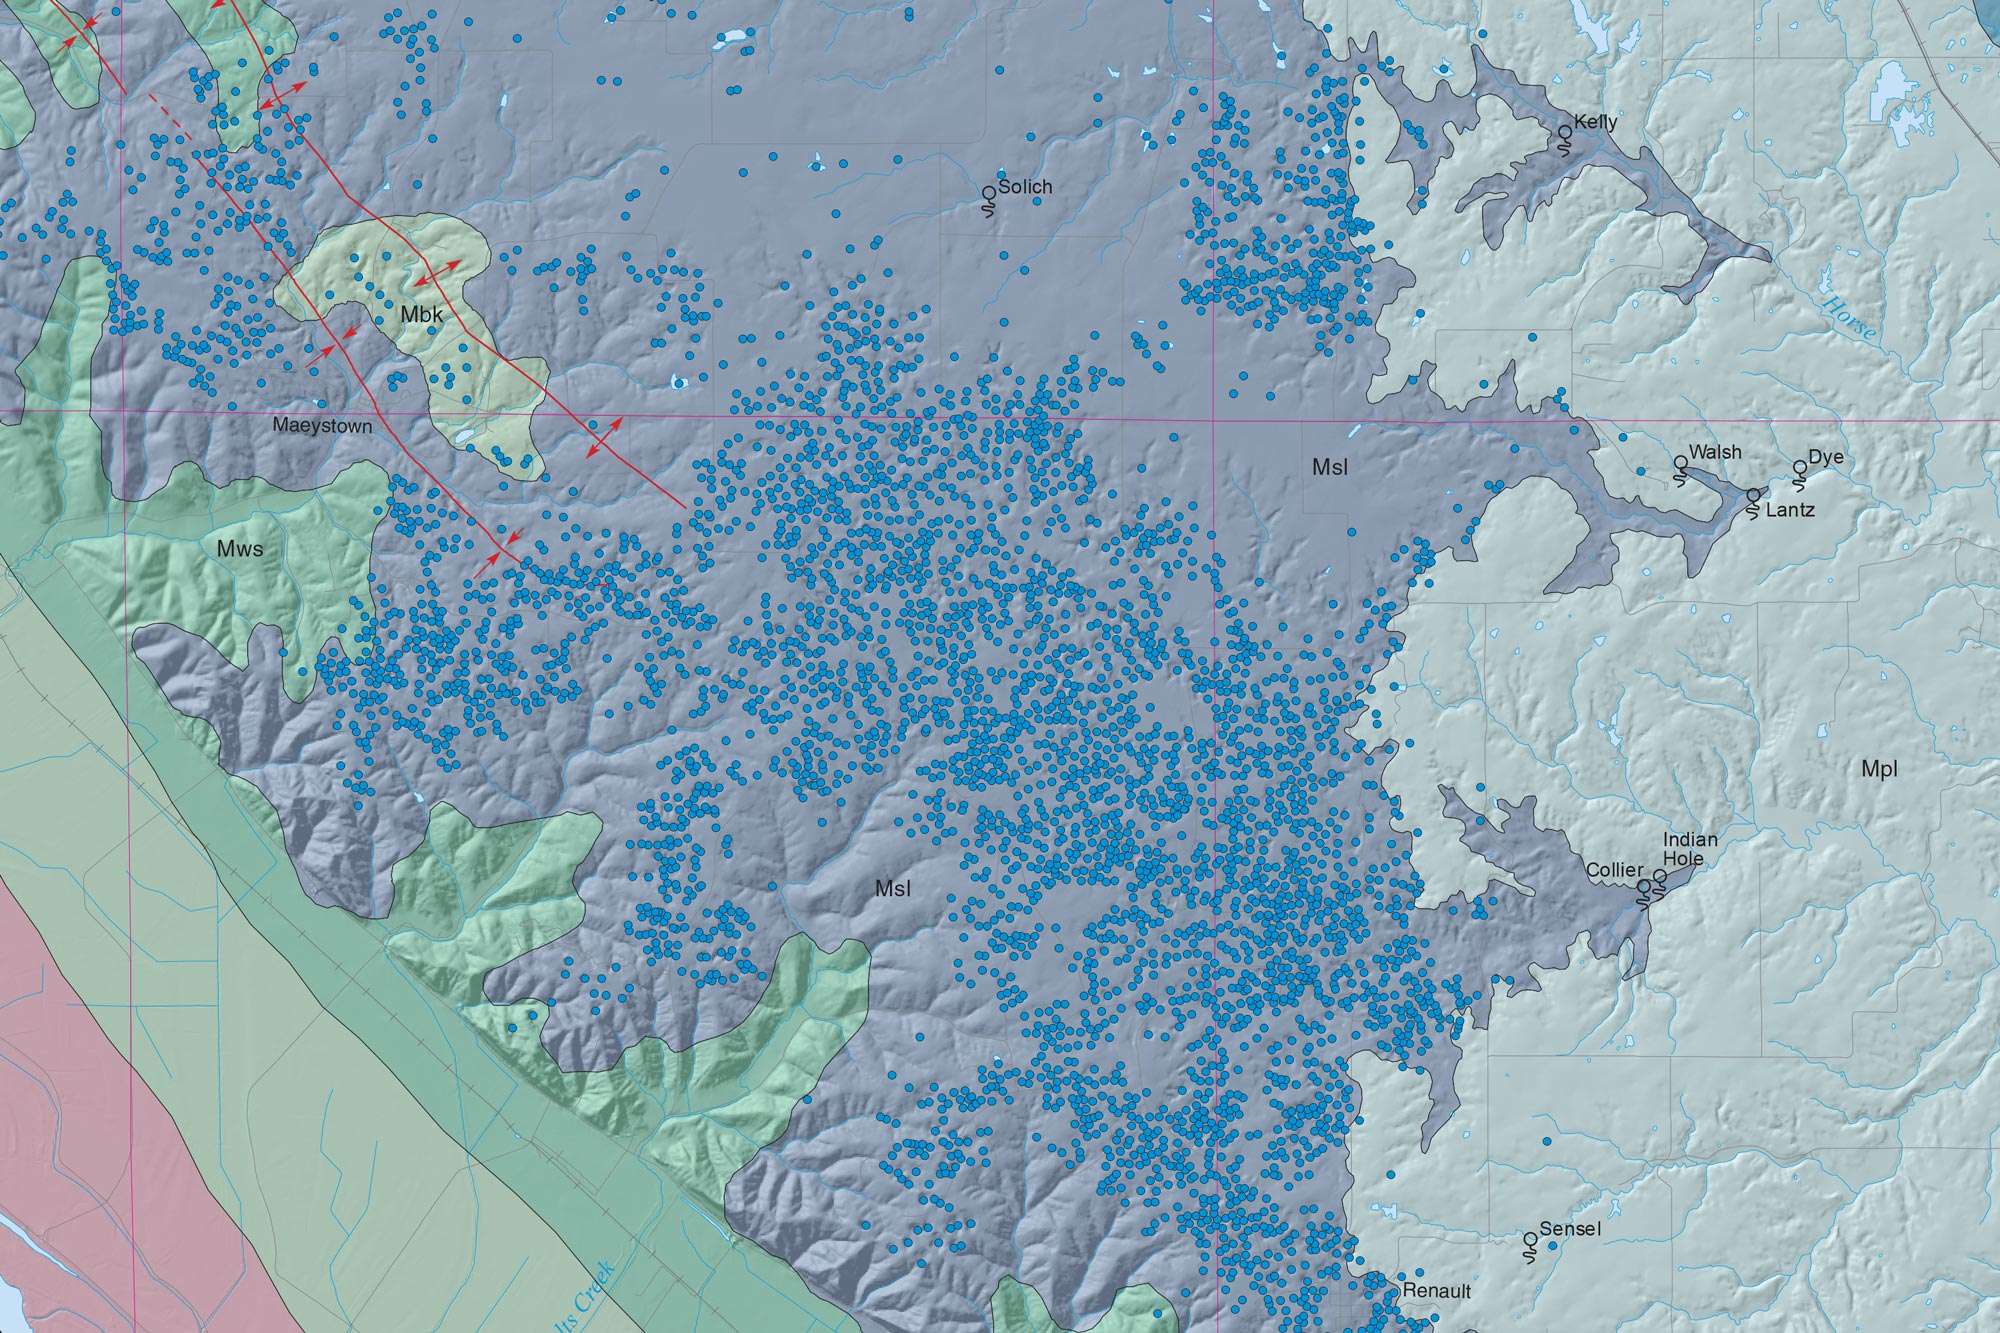
Portion of a map depicting sinkhole locations (blue circles) in Monroe County, Illinois.
Unveiling the depths: ISGS helps navigate sinkhole data
The ISGS provides up-to-date downloadable data about sinkholes for the entire state to inform decisions on community planning and development. Geologists use GIS databases to analyze LiDAR, a remote sensing method that uses laser pulses to measure distances. This helps identify and differentiate sinkholes from other depressions in the Earth using shaded imagery. The Illinois Height Modernization Lidar Data and the statewide 1:500,000-scale bedrock geology map layer define areas of underlying carbonate bedrock. The sinkhole inventory includes two GIS datasets: Illinois Sinkhole Points and Illinois Sinkhole Areas.
Additional ISGS maps pertaining to karst areas of the state include Karst Terrains and Carbonate Rocks of Illinois and Sinkhole Distribution and Associated Karst Features of Monroe County, Illinois.
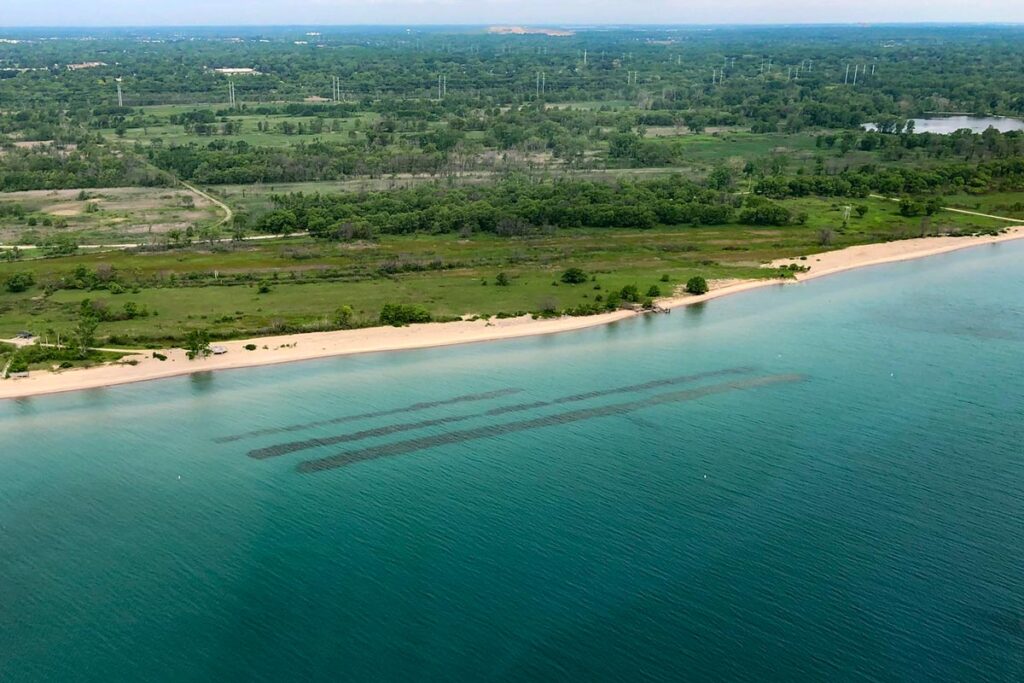
Historic shoreline levels along Illinois Beach State Park in Zion, Illinois.
Rising tides, falling shores: ISGS scientists harness technology to protect Illinois’ precious coastline
Illinois’ Lake Michigan shoreline is constantly undergoing changes that can affect property values, public infrastructure, navigability, commercial fishing, and public recreation and threaten sensitive ecosystems.
ISGS staff work closely with the Illinois Department of Natural Resources Coastal Management Program (CMP) and other agencies to monitor sites along Illinois Beach and nearby shoreline areas, the Illinois bluff coast in the Fort Sheridan area and select Chicago urban beaches, providing valuable coastal information to CMP, the Chicago Park District, and the US Army Corps of Engineers to help address these challenges.
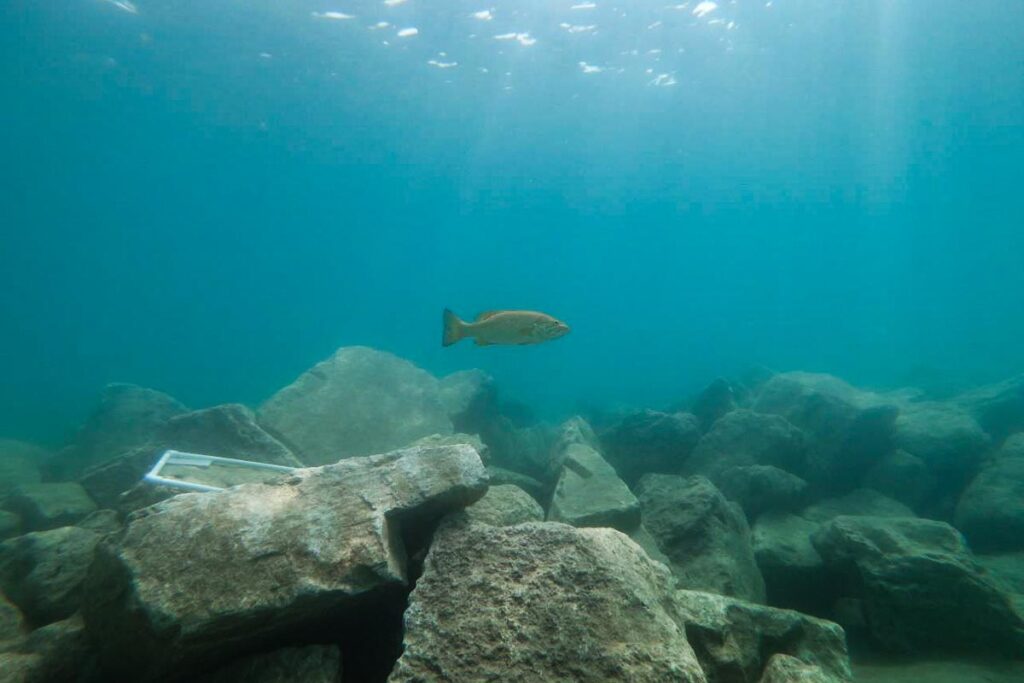
Located along the Lake Michigan coastline, Illinois Beach State Park (IBSP) is home to some of the last remaining natural shorelines in Illinois, rare coastal wetland habitats, and several threatened and endangered plant and animal species. The park is also a recreation hotspot for activities such as fishing, swimming, boating, hiking, and birding. Unfortunately, the ecological and recreational utility of IBSP is threatened by severe coastal erosion, which has consumed over 100 acres of habitat in the past 80 years.
ISGS scientists work with state agencies to design and implement strategies for preserving the park’s shorelines and ecosystems. ISGS scientists study patterns and causes of sediment erosion and deposition, create models of shoreline erosion and habitat vulnerability, and construct carbon budget and hydrologic models for IBSP wetlands to help inform management decisions.
ISGS is currently assessing the effectiveness of three submerged “rubble ridges” offshore of IBSP and Zion’s Hosah Park — shoreline stabilization structures built by the US Army Corps of Engineers in 2021 to lessen storm wave impact on the shoreline and protect beach and wetland habitats. Specifically, staff are monitoring the structures’ impact on hydrodynamics and coastal change. If successful, this structure design would offer other Great Lakes communities a low-cost method for protecting their shorelines.
Using aerial drones, ISGS researchers acquire high-resolution imagery and beach topographic data to map and quantify changes to the beach and shoreline. This method is used for pre-and post-storm assessments, seasonal investigations, for example, effects of shore ice, and long-term assessments of lake-level changes. These ISGS data provide valuable insights into coastal landform-change dynamics and vegetation succession, helping to inform coastal management strategies in response to changing lake levels and other environmental factors.
ISGS scientists use specialized instruments and buoys to collect accurate, timely information on Lake Michigan’s hydrodynamic conditions, including wave heights, directions, and speed, which are used by the National Weather Service to provide real-time wave and forecast data needed to keep people safe while in and around Lake Michigan.
A tale of two surveys — sonar mapping and seismic reflection
Offshore, ISGS staff use precision surveying techniques including sonar for mapping lake depths and seismic reflection, which can map the lake bottom subsurface and provide insights into sand thickness.
These surveys help scientists better understand the topography and dynamics of the lakebed. ISGS scientists study shoreline and lake-bottom sediments to shed light on past environmental conditions and how environments change over time. They use reflection geophysics and sediment core data to map the subsurface architecture and age structure of the Zion Beach–Ridge Plain as well as marine seismic surveying and coring methods to map sediment distributions in the Chicago nearshore zone.
Understanding both shoreline and lake-bottom sediment patterns is necessary to conduct future land development and conservation and restoration as well as to support managing beach erosion and mitigating sediment contamination.
Data from various projects on coastal geology are available on the ISGS Illinois Geospatial Data Clearinghouse. Drone data collected from the Illinois State Beach Park are also available in the clearinghouse. Two story maps, A Vanishing Coast and A Dynamic Shoreline, illustrate from a drone’s viewpoint how researchers monitor the coast at Illinois State Beach Park.